Are you ready to unlock Google Analytics’ power but feel lost? This guide is for you! It will take you through the basics of google analytics for beginners. You’ll learn how to use its insights to boost your online presence.
Discover how to harness the power of Google Analytics for beginners. Learn essential tracking, reporting, and analysis techniques to boost your website’s performance today. Google Analytics 4 (GA4) is full of data, but it can be hard to navigate for newcomers. Don’t worry, we’ll simplify the Google Analytics basics. You’ll learn how it works and what reports and metrics are key. By the end, GA4 will be your ally in making your website and marketing better.
Let’s start exploring Google Analytics tracking, Google Analytics reports, and Google Analytics metrics. These will help you make smart decisions for your online success.

Key Takeaways
- Google Analytics is a free tool that shows how people interact with your website.
- Learn the basics of setting up and using the Google Analytics 4 (GA4) platform.
- See how to understand important Google Analytics reports and Google Analytics metrics to improve your content and marketing.
- Find out why Google Analytics tracking and setting Google Analytics goals are crucial to measuring your website’s success.
- Discover how Google Analytics ecommerce and Google Analytics filters can give you deeper insights into your data.
What is Google Analytics?
Google Analytics is a free tool from Google that helps you understand your website’s performance. It tracks your website’s traffic, user behavior, and how well your marketing works. This tool gives you the insights you need to improve your online presence and grow your business.
Google Analytics Explained
Google Analytics is a platform that collects data from your website. It looks at things like traffic, who visits your site, how long they stay, and what they do. This info is easy to see in a dashboard, helping you understand your website and its visitors better.
Benefits of Google Analytics
- Measure website performance: Google Analytics shows you how your website is doing in terms of traffic, user actions, and content performance.
- Evaluate marketing efforts: It helps you see which marketing campaigns work best so you can focus on what’s effective.
- Personalize content and experiences: The data from Google Analytics lets you make your website more tailored to what your visitors like.
- Identify top-performing pages: You can find out which pages on your site are the most popular, helping you focus on making them even better.
- Segment and analyze user data: You can look at your website’s users in different ways, like by age or interests, to get to know them better.
Google Analytics is a key tool for businesses of all sizes. It helps you track, analyze, and improve your online presence. This leads to smarter decisions and better marketing strategies.
Setting Up Google Analytics
Starting with Google Analytics unlocks data-driven insights. This first step helps you understand your website’s performance and user behavior. By creating an account and adding the tracking code, you’ll see important metrics for your business.
Creating a Google Analytics Account
First, go to the Google Analytics website and sign up for a new account. You’ll need to give some basic info about your website, like the URL and industry. Then, Google Analytics will give you a unique tracking code to add to your site.
Adding the Tracking Code
- Copy the tracking code from Google Analytics.
- Paste it into your website’s HTML header between the
<head>and</head>tags. - Or, use Google Tag Manager to manage and add the code easily.
With the tracking code on your site, Google Analytics will collect data on visitors and their actions. This info is key to improving your online presence and growing your business.
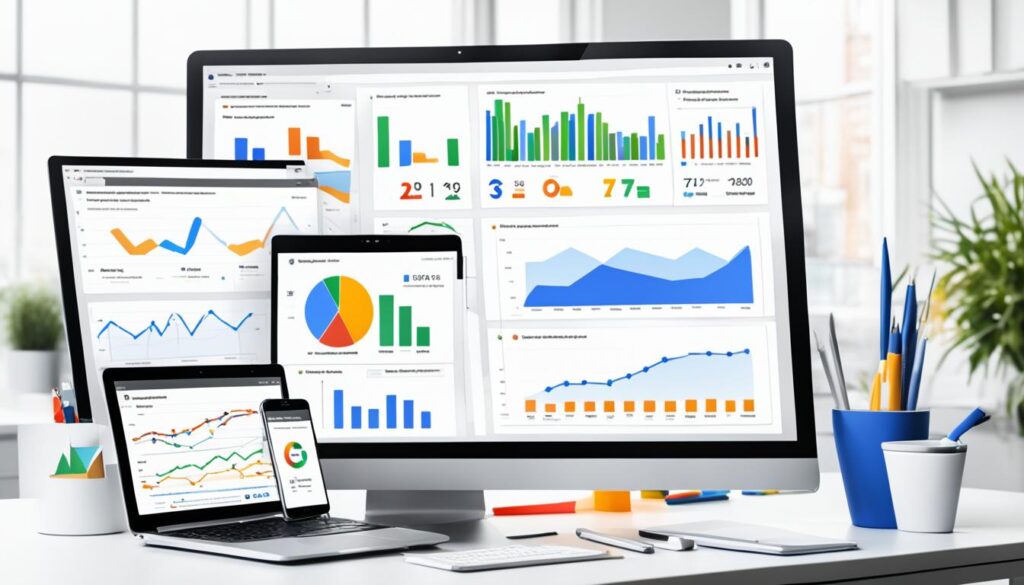
“Google Analytics is a powerful tool that provides a wealth of data to help businesses understand their website’s performance and make data-driven decisions.” – John Doe, Digital Marketing Expert
Setting up Google Analytics and analyzing its data helps you make smart decisions. It lets you optimize your marketing and drive success online. Explore Google Analytics’ full features to use it to its fullest.
Understanding the Google Analytics Interface
After setting up your Google Analytics account and adding the tracking code to your site, it’s time to check out the interface. The main page gives you a quick look at how your site is doing. You’ll see important stats like the number of users, new visitors, how long they stay, and the number of actions they take.
The sidebar on the left has lots of options for reports. You can explore different parts of your site’s data here. This includes where your visitors come from, what they do on your site, and how they convert.
The Google Analytics interface is great because it uses tables, charts, and graphs. These visuals help you see trends, understand user behavior, and find insights for your marketing plans.
| Google Analytics Interface | Key Metrics |
|---|---|
| Homepage |
|
| Navigation Sidebar |
|
The Google Analytics interface gives you lots of insights to improve your site and marketing. It offers real-time reports and deep analysis of your audience. This helps you make smart decisions and boost your online success.
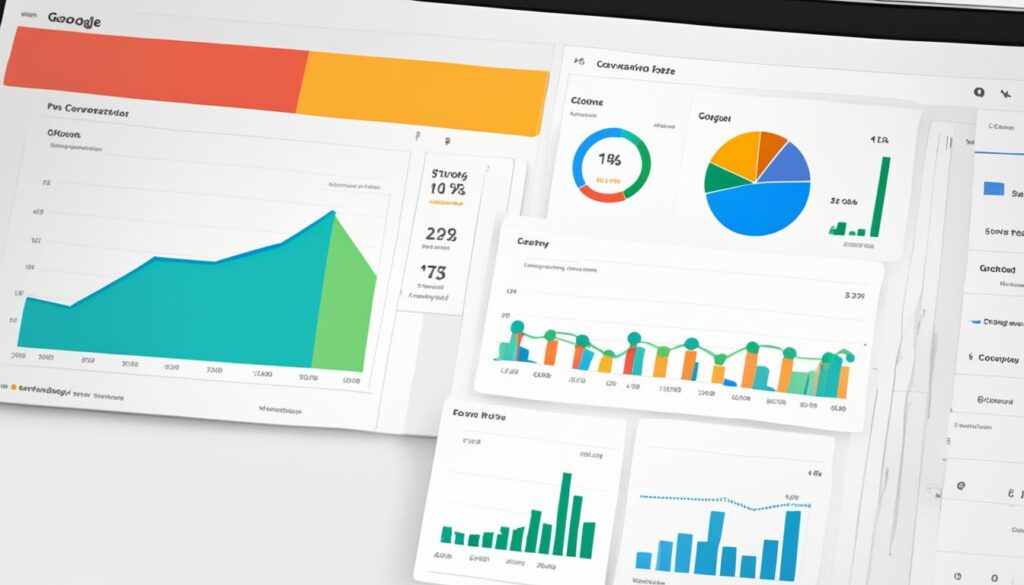
Real-time Reporting
The Real-time reporting feature in Google Analytics shows what’s happening on your website or app right now. It lets you see how your site or app is doing as it happens. You get to know what users are doing and how they’re interacting with your content.
This report shows how many users are active in the last 5 and 30 minutes. You can look at where these users come from by segmenting them by source, medium, platform, or campaign. It also tells you what content they’re checking out, what actions they take, and what they complete.
But it’s good to know that Real-time reporting has some limits. For example, mobile devices group data to save battery life, which might delay reports. Also, if no one is using your site, you won’t see any data. Also, changes to your views might take up to two hours to show up in the report.
Even with these limits, Real-time reporting is a powerful tool. It helps you quickly see what users are doing, track your marketing campaigns, and spot any problems or trends right away.
| Feature | Description |
|---|---|
| User Activity | The Real-time report displays the number of users on your website or app in the last 5 and 30 minutes. |
| Segmentation | Users can be segmented by first user source, medium, source platform, or campaign to track where they are coming from. |
| Behavior Insights | The report provides insights into the content users are viewing, the events they trigger, and the key events they complete. |
| Limitations | Mobile hits are batched to conserve battery life, resulting in possible delays in reporting. Changes made to views may take up to two hours to reflect in the report. |
In summary, the real-time user data and real-time website analytics from Google Analytics are great for understanding and reacting to what users do on your site or app instantly.
Acquisition Reports
The Acquisition reports in Google Analytics give you deep insights into how people find and interact with your website. They break down your website traffic sources. This helps you see which marketing efforts bring in the most valuable visitors.
Traffic Sources: Identifying Your Winning Channels
The Acquisition Overview report in Google Analytics sorts your website traffic into channels like organic search, direct, referral, paid search, and organic social. By looking at this data, you can see which channels bring in the best traffic. This lets you focus your marketing on the most effective sources.
Marketing Campaigns: Measuring Performance
The Acquisition reports also show how well your marketing campaigns are doing. You can see how many users, sessions, and conversions each campaign gets. This helps you make smart decisions about your marketing strategy and use your budget wisely.
| Channel | Users | Sessions | Conversion Rate |
|---|---|---|---|
| Organic Search | 12,345 | 15,678 | 3.5% |
| Direct | 6,789 | 8,901 | 2.8% |
| Referral | 4,321 | 5,432 | 1.9% |
| Paid Search | 3,456 | 4,567 | 4.2% |
| Organic Social | 2,109 | 2,543 | 2.1% |
Using the insights from the Acquisition reports, you can improve your website traffic sources and marketing campaign performance. This ensures your digital marketing is as effective as possible.
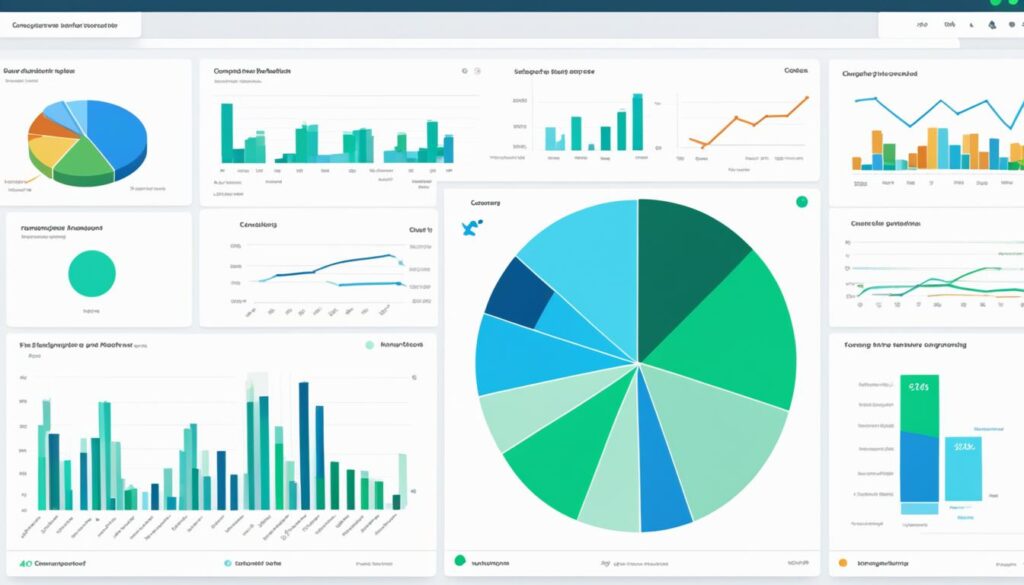
Google Analytics for Beginners: Understanding the Powerful Tool for Tracking Website Performance
Google Analytics is a powerful tool that gives deep insights into your website’s performance and user behavior. For beginners, it might seem hard to navigate its features and reports. But, with a good grasp of the basics, you can use it to make data-driven decisions and improve your online presence.
This guide will cover the essential parts of Google Analytics for beginners, including the Google Analytics tutorial for beginners and Google Analytics basics. By the end, you’ll know enough to start using Google Analytics and unlock insights that can boost your website’s success.
Understand the Power of Google Analytics
Google Analytics is a free tool from Google that’s vital for businesses and website owners. It lets you track and analyze key metrics, such as:
- Number of users and sessions
- Pageviews and bounce rates
- Traffic sources and marketing campaign performance
- User engagement and conversions
Knowing these metrics helps you make better decisions to enhance your website’s content, user experience, and marketing strategy.
Getting Started with Google Analytics
To start with Google Analytics, set up an account and add the tracking code to your site. It’s easy and can be done in a few steps:
- Create a Google Analytics account
- Set up a new property for your website
- Get the unique tracking code
- Add the tracking code to your website
After adding the tracking code, Google Analytics will collect data on your site’s traffic and user behavior. This data appears in the Google Analytics interface, letting you explore and analyze the insights.
As a google analytics beginner, it’s key to get to know the platform’s reports and features. Spend time exploring the dashboard, learning about different metrics, and figuring out how to interpret the data for better decisions about your website.
“Google Analytics is a game-changer for website owners who want to make data-driven decisions and improve their online presence.”
By using the Google Analytics tutorial for beginners and grasping the Google Analytics basics, you can fully benefit from this powerful tool. This will help take your website to new heights.

Behavior Reports
The Behavior Reports in Google Analytics show how users interact with your website. They look at website page views and user engagement metrics. This info helps you make your content better and improve the user experience.
Page Views: Tracking Content Popularity
The Page Views report in Google Analytics shows how well individual pages on your website do. You can look at total page views, unique page views, average time on the page, and bounce rate. This helps you see what content is doing well and what needs work.
For instance, the “Google Redesign Apparel” page got 433 entries, spent an average of 1:22 on the page, had a 34% bounce rate, and a 22% exit rate. Looking at these numbers, you can understand how engaged users are and make smart choices to improve your content.
User Engagement: Diving into Interactions
The User Engagement metrics in Google Analytics give you a closer look at how users interact with your site. They include average session duration, pages per session, and bounce rate. These metrics are key to understanding how users behave and what they like.
The Behavior Flow report in Google Analytics is great for seeing how users move through your site. It shows where people stop, where they go, and which pages are crucial. This helps you spot content issues and improve the user experience.
By using the Behavior Reports in Google Analytics, you can get lots of insights. These insights help you plan your content, boost user engagement, and get better results for your website.
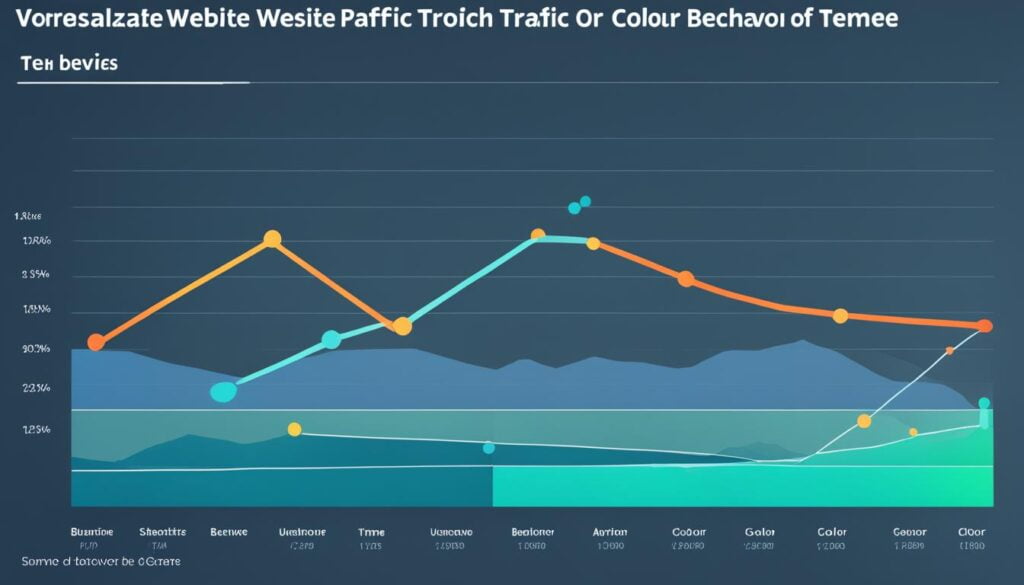
Conversion Tracking
Conversion tracking is key in Google Analytics. It helps businesses see how their marketing works. By setting up goals, you can track actions like form submissions or purchases. This info lets you focus on what works best and improve your strategies.
Setting Up Conversion Goals
To use conversion tracking in Google Analytics, just follow these steps:
- Log into your Google Analytics account and go to the “Admin” section.
- Under the “View” column, click on “Goals” to see where you set goals.
- Click on the “New Goal” button to make a new conversion goal.
- Pick the goal type you want to track, like a destination or event.
- Set up the goal, including the URL or event settings.
- Check the goal setup and turn it on to track conversions.
Google Analytics 4 gives you more control over conversions. You can make custom events and use Google Tag Manager to track specific actions.
| Metric | Description | Importance |
|---|---|---|
| google analytics conversion tracking | Identifies actions that lead to goals, like form submissions or purchases. | Helps businesses see what their marketing gets back and improve strategies. |
| google analytics goals | Actions or events in Google Analytics that show success for a website. | Shows how well marketing campaigns work and guides decisions. |
| website conversions | Actions visitors take that match what a business wants, like buying something or filling out a form. | Measures how well a website does and how marketing drives actions. |
“Conversion tracking is the key to unlocking the full potential of your marketing efforts. By understanding which user actions lead to desired outcomes, you can refine your strategies and maximize your returns.”
Audience Reports
Google Analytics gives you deep insights into who visits your website. These audience reports show you the age, gender, interests, and where your visitors come from. This info helps you make better marketing plans, improve the site, and reach your audience better.
The Google Analytics audience reports give you a clear view of who visits your site. You can see the user demographics, like age and gender, to know your audience better. The interest reports also show what your visitors like, helping you create content they’ll enjoy.
Looking at where your visitors come from helps you focus on areas with lots of potential. This detailed info lets you make smart choices and boost your online presence.
| Audience Report Metric | Benefit |
|---|---|
| Age | Understand the age distribution of your visitors to create age-appropriate content and offers. |
| Gender | Tailor your marketing messages and product recommendations based on the gender demographics of your audience. |
| Interests | Leverage interest-based insights to enhance the relevance of your content and advertising, leading to higher engagement and conversions. |
| Location | Identify high-performing geographic regions to optimize your marketing efforts and target new audiences effectively. |
Using Google Analytics audience reports helps you make smart choices for your website and marketing. Dive into your visitors’ demographics to find out how to grow and succeed.
Customizing and Filtering Data
Google Analytics gives you valuable insights right out of the box. But making custom reports lets you dig deeper into what’s important for your business. With data filtering and data segmentation, you can focus on the key performance indicators (KPIs) that matter. This gives you a clearer picture of your audience and how your website is doing.
Creating Custom Reports
Experts suggest having at least three views for each property in your Google Analytics account. You should have a Main/Primary view for regular analysis, a Raw reporting view for backups without filters, and a Test reporting view to try out new filters. This setup helps you get accurate data and lets you experiment safely.
Google Analytics lets you filter data in many ways, like by ISP domain, IP addresses, or sub-directories. You can apply these filters in the right order to get the right data for your views.
Some important filters to think about include excluding internal traffic, making campaign tags lowercase, and adding domain names to reports. But, avoid filters based on location, campaign tags, devices, or query parameters. These can mess up your data.
Using Google Analytics custom reports, data filtering, and data segmentation can give you a deeper look into your website’s performance. This helps you make better decisions to grow your business.
“The importance of providing details, research, and avoiding opinion-based statements is highlighted for effective contributions on the platform.”
Interpreting Google Analytics Data
Learning how to read Google Analytics reports is key to making good decisions. By looking at how users behave, what they engage with, and how they convert, you can improve your online strategies. It’s a mix of science and art, needing patience, practice, and an eye for trends.
Google Analytics has lots of data that can help you understand your website better. Focus on the metrics that help you reach your business goals. Important reports to check include:
- Audience Reports: Learn about your visitors, like who they are, what they like, and what devices they use.
- Acquisition Reports: See how people find your site, whether it’s through search, ads, or links.
- Behavior Reports: Look at how engaged users are, like how long they stay, how many pages they view, and if they leave quickly.
- Conversion Reports: Track how well your goals are doing, like filling out forms or making sales, to get better results.
By looking at these reports, you can find insights that help you make data-driven decisions. This can improve your website performance optimization efforts.
| Metric | Description | Importance |
|---|---|---|
| Sessions | The percentage of users who did what you wanted them to, like buy something or fill out a form. | Shows how engaged users are and trends in traffic. |
| Pageviews | The total number of pages viewed, counting repeats. | Helps see how deeply users engage and consume content. |
| Bounce Rate | The percent of visits that only viewed one page and didn’t interact with the site. | Points out pages that might need work to keep users interested. |
| Conversion Rate | The percent of users who did what you wanted them to, like buy something or fill out a form. | Helps see if your efforts to get conversions are working. |
By understanding these reports and their insights, you can make smart choices. This can improve the user experience, your marketing strategies, and your data-driven decision-making for your business.
“The goal is to turn data into information, and information into insight.” – Carly Fiorina
Integrating Google Analytics with Other Tools
Google Analytics is a powerful tool that shines when it works with other marketing platforms. By linking it with other data sources, businesses get a full view of their customers and marketing success. This creates a data-driven ecosystem that offers deep insights.
Connecting Google Analytics with Google Ads is very useful. It lets businesses see how ads affect website traffic, user actions, and sales. This helps marketers make better decisions and get more from their ad spending.
Google Analytics also works well with Google Search Console. This tool shows how your website does in organic search. Together, they give you a clear picture of your site’s search engine performance and which keywords bring in traffic.
Google Analytics can also link with e-commerce platforms, CRM systems, and other marketing tools. For instance, it can connect with Salesforce to provide a full view of customer behavior. Or, it can work with Mailchimp to show how email campaigns affect website visitors.
These integrations help businesses build a strong marketing strategy. They combine Google Analytics with other key tools. This way, they can measure marketing success, make smarter choices, and grow sustainably.
| Integration | Benefits |
|---|---|
| Google Ads | Track the performance of paid advertising campaigns and optimize ad spend |
| Google Search Console | Gain insights on organic search performance and keyword-driven traffic |
| Salesforce | Uncover insights on which channels generate the most high-value phone calls. |
| Mailchimp | Analyze how website visitors interact with email marketing campaigns |
| Nimbata | Uncover insights on which channels generate the most high-value phone calls |
The need to link Google Analytics integrations with other Google Analytics and other marketing tools will grow as the digital world changes. By using a data-driven marketing approach, businesses can make better choices, refine their marketing, and grow steadily.
Conclusion
In this guide, we covered the basics of Google Analytics 4 (GA4). We gave beginners a strong start to use data insights effectively. You learned how to set up your account and understand the interface. You also learned how to navigate reports and customize your analysis.
Now, you know how to use Google Analytics for beginners in your business. By following Google Analytics best practices, you can make decisions based on data. This will improve your website’s performance and user experience.
The Google Analytics tutorial we shared will help you use this powerful tool. It will help you optimize your online presence and reach your business goals.
Google Analytics is all about using data to make smart choices. It’s important to check your metrics often and adjust your plans as needed. With what you’ve learned, you’re ready to start optimizing your business with data. You can now make decisions that will move your business forward.
FAQ
What is Google Analytics?
Google Analytics is a free tool from Google. It tracks and reports on website traffic and user behavior. It gives insights into how visitors use your website.
How do I set up Google Analytics for my website?
First, create a Google Analytics account. Then, add the tracking code to your website. This lets Google Analytics collect data on your visitors and their actions.
What are the key reports in Google Analytics?
Key reports include Realtime, Acquisition, Behavior, Conversion, and Audience. They show traffic sources, user engagement, and conversion rates.
How can I use Google Analytics to track my marketing campaigns?
Use Acquisition reports to track your marketing campaigns. This shows which channels and campaigns bring the most valuable traffic to your site.
How do I set up conversion tracking in Google Analytics?
Define your conversion goals, like form submissions or purchases, in Google Analytics. This helps measure your marketing success and improve your site for better conversions.
How can I customize the reports in Google Analytics?
Create custom reports and filters in Google Analytics to focus on important data. This helps you focus on the metrics that matter most for your business.
How do I interpret the data in Google Analytics?
Understanding Google Analytics data means knowing the key metrics and spotting trends in user behavior. It takes practice to see how to improve your site and user experience.
How can I integrate Google Analytics with other marketing tools?
Integrate Google Analytics with tools like Google Ads, Google Search Console, and e-commerce platforms. This creates a full data ecosystem and helps understand your customers’ journey better.
